

Calulating Grms
(Root-Mean-Square Acceleration)
It is very easy to describe the Grms (root-mean-square acceleration, sometimes written as GRMS or Grms or grms or grms) value as just the square root of the area under the ASD vs. frequency curve, which it is. But to physically interpret this value we need to look at Grms a different way. The easiest way to think of the Grms is to first look at the mean square acceleration.
Mean-square acceleration is the average of the square of the acceleration over time. That is, if you were to look at a time history of an accelerometer trace and were to square this time history and then determine the average value for this squared acceleration over the length of the time history, that would be the mean square acceleration. Using the mean square value keeps everything positive.
The Grms is the root-mean-square acceleration (or rms acceleration), which is just the square root of the mean square acceleration determined above.
If the accelerometer time history is a pure sinusoid with zero mean value, e.g., a steady-state vibration, the rms acceleration would be .707 times the peak value of the sinusoidal acceleration (if just a plain average were used, then the average would be zero). If the accelerometer time history is a stationary Gaussian random time history, the rms acceleration (also called the 1 sigma acceleration) would be related to the statistical properties of the acceleration time history (you may have to refresh your probability and statistics knowledge for this):
- 68.3% of the time, the acceleration time history would have peaks that would not exceed the +/- 1 sigma accelerations.
- 95.4% of the time, the acceleration time history would have peaks that would not exceed the +/- 2 sigma accelerations.
- 99.7% of the time, the acceleration time history would have peaks that would not exceed the +/- 3 sigma accelerations.
There is no theoretical maximum value for the Gaussian random variable; however, we typically design to 3 sigma since it would only be theoretically exceeded 0.3% of the time. In addition, from a practical point of view, we know that it would be physically impossible to achieve unreasonably high sigma values.
Below is presented the method to calculating the root-mean-square acceleration (Grms) response from a random vibration ASD curve.
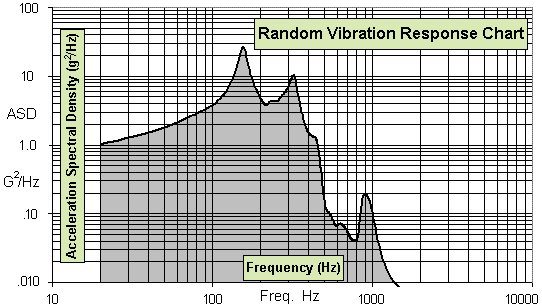
Typical random vibration response curve:

Grms values are determined by the square root of the area under a ASD vs. frequency response curve. The Acceleration Spectral Density values are in g2/Hz and the frequencies are in Hz.

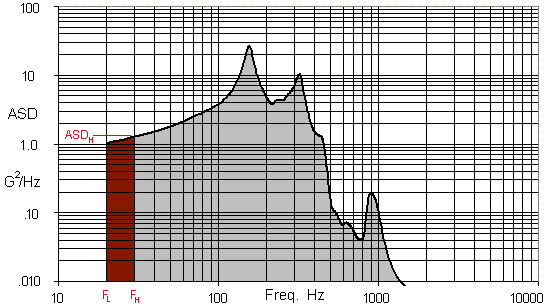
The figure above shows a bandwidth of 10 Hz, which will be used as an example for calculating Grms.
- First, calculate the number of octaves. From the plot, FL = 20Hz and FH = 30Hz. The equations below gives #octaves = 0.58 .

- Second, calculate the dB value. For FL = 20Hz, ASDL = 1.0 g2/Hz, while ASDH = 1.1 g2/Hz. The calculated value is 0.41 dB. (The definition of dB is also provided.)

- Third, calculate the slope, m, of the segment between the frequencies FL and FH. Dividing the number of dB by the number of octaves gives m = 0.71 dB/oct.

- Fourth, calculate the area under the curve between the frequencies FL and FH. In our example, A = 10.53 g2.

NOTE - The above equation is invalid if the slope m = -10log(2) because you would be dividing by zero.
If m = -10log(2), use the following equation for the area:
(L'hôpital's Rule is used to solve the equation as the limit of [1 + m/(10log2)] goes to zero -- or some such nonsense.) - Finally, take the square root of the area for the Grms value. To finish our example, the acceleration = 3.24 Grms.

In order to calculate the Grms value for the entire curve, sum up all the areas (A1 + A2 + A3 + ... + An = A) and take the square root of the sum.
NOTE: 3dB is a factor of 2 for ASD curves (g2/Hz) while 6dB is a factor of 2 for Grms values. For example, reducing a peak ASD value of 12g2/Hz by -3dB would give you 6g2/Hz; reducing a value of 12Grms -3dB results in a value of 9Grms and reducing it -6dB results in a value of 6Grms. This tends to be confusing for people new to random vibration.
An Excel 97 spreadsheet, grms.xls, written by Bob Coladonato that calculates all these values is available for downloading. The only input values necessary are frequencies and their respective ASD levels.
Microsoft Excel 97 Spreadsheet for Grms calculations. (Hold your shift key down while clicking on the link to save the file to your hard drive.)
An Excel 95 version, grms95.xls, is also available.
Thanks to Bob Coladonato and Bill Case, both now retired from Goddard, and Jaap Wijker of University of Technology Delft in the Netherlands for their assistance with this page.
Ryan Simmons
August 1997