MSC.NASTRAN Random Vibration Example

Following is an example of an MSC.Nastran v. 2001 random vibration analysis run. All the NASTRAN cards necessary to perform a random run are described here. Comments follow the card (or cards) being described. The random-specific cards are in bold. The model is a simple cantilever beam with 48 elements and 49 nodes. It lies along the Y-axis with the first node, 101 at the origin. The downloadable data file can be found at the bottom of this page.

NOTE: This method will only work for MSC's version 2001 or later of NASTRAN because they (finally!) did away with the large mass needed to do frequency response runs. This method is extremely similar to UAI's version of frequency response runs. (See notes below for the differences.)

If you are using MSC/NASTRAN version 70.7 or earlier, then you still need to use the large mass. An example of this method is given on the Seismic Mass Frequency Response page.

Index:
ACCE | Bulk Data Deck | Case Control | DLOAD | Eigenvalue Output | EIGRL | ENDT | Example Plot | Executive Control | FREQ | FREQ1 | FREQ3 | INCLUDE | METHOD | Output Summary | OUTPUT(XYPLOT) | PSDF | Punch Output | RANDOM | Random Output | RANDPS | RESVEC | RLOAD2 | RMS Values | SDAMPING | Shaker Point | SOL | SPC | SPC1 | SPCD | SPCFORCES | TABDMP1 | TABLED1 | TABRND1 | XYPEAK | XYPLOT | XYPUNCH

Input Data Deck

$EXECUTIVE CONTROL DECK
ID BEAM,RANDOM
SOL 111
Modal Frequency Response Solution Number
$
TIME 10
CEND
$
$CASE CONTROL DECK
TITLE = RANDOM VIBRATION EXAMPLE MODEL
SUBTITLE = 48-ELEMENT CANTILEVER BEAM ON THE X-AXIS
LABEL = Y-DIRECTION RANDOM INPUT OF 0.01 G^2/HZ FROM 20-2000HZ
$ Beam is along the X-axis and is 48 inches long

$
SPC      = 1
METHOD   = 1
DLOAD    = 10
SDAMPING = 20
RANDOM   = 30
FREQ     = 40
SPC refers only to the SPC1 card (not the SPCD card);
METHOD refers to EIGR card;
DLOAD refers to RLOADx card;
SDAMPING refers to TABDMP1 card;
RANDOM refers to RANDPS card;
FREQ refers to all FREQx cards used
$
ECHO = NONE
$
$SET 99 = 101
$SPCFORCES(PHASE) = 99
The preceding two cards are used for shaker point force recovery only (remove $ if needed).
SET 99 sets the shaker GRID 101 output;
SPCFORCES requests force recovery at SET 99 (see OUTPUT and SPCD cards below)
$
OUTPUT(XYPLOT)
XYPEAK,XYPUNCH,ACCE,PSDF/ 101(T2),149(T2)
Cards used for plot output.
NOTE: THIS IS THE ONLY WAY TO GET RANDOM OUTPUT!
OUTPUT card is required to use XYPLOT commands;

XYPEAK recovers RMS and other peak responses in the .prt file (required for RMS output);
XYPUNCH creates a .pch file of response vs. frequency;
ACCE requests acceleration output (FORCE requests force output);
PSDF requests output as PSD;
GRID point 101 and 149 responses recovered; T1=X, T2=Y, T3=Z, as well as R1, R2, and R3

$
BEGIN BULK
$
PARAM,AUTOSPC,YES
PARAM,GRDPNT,0
PARAM,RESVEC,YES
PARAM,RESVEC,YES is REQUIRED for accurate results when NOT using the seismic mass. It computes residual vectors.
$
GRID         101       0      0.      0.      0.       0
Shaker grid point. Often this is an RBE element attached to many GRID points with the independent GRID being the shaker point.
$
SPC1           1  123456     101
The Shaker point is SPC’d in all DOF
$
RLOAD2,10,11,,,12,,ACCE
RLOAD defines frequency response dynamic loading;
LOAD = SPCD * TABLED1 [= A * B(f)];
11 IS SPCD card;
12 IS TABLED1 card;
ACCE refers to type of dynamic excitation, enforced acceleration in this case. Other options are LOAD for applied load, DISP for enforced displacement, and VELO for enforced velocity.
$
SPCD,11,101,2,1.0
Y-axis input at GRID 101;
2 refers to input direction (1=X, 2=Y, 3=Z);
1.0 is any scale factor;
$
$SPCD,11,101,2,386.4
Use this card instead when recovering forces or displacements (assuming you're using the inch/pound system), such as at the shaker point. If you're using a metric based system, such as mm/gram, then 386.4 becomes 9807. (You can also change the 1.0 values in the TABLED1 card below to the acceleration value and get the same result. But do not change both.)
$
TABLED1       12     LOG     LOG                                        +
+           20.0     1.0  2000.0     1.0    ENDT
TABLED1 is a tabular function defining the frequency-dependent portion of RLOAD2
The table is given as X1,Y1, X2,Y2, X3,Y3, etc.;
20.0 is the beginning frequency (X1); 1.0 is the magnitude (Y1);
2000.0 is the ending frequency (X2); 1.0 is the magnitude (Y2);
The Y values are used as scale factors; the actual Y values are entered as random input in TABRND1 below (not frequency input);
The LOG LOG entries refer to how the data is interpolated on each axis.
 
NOTE: All tables MUST end with an ENDT card.
Also, tables are not always compatible between UAI/NASTRAN and MSC/NASTRAN. The tables used in the older version of this example would not work under Nastran 2001.
$
TABDMP1       20                                                        +
+           20.0     0.1  2000.0     0.1    ENDT
Defines modal damping of Q=10;
The damping is 1/Q over the range of frequencies; in this case Q is constant. Q can vary over frequency if the proper data is available.
$
RANDPS,30,1,1,1.0,0.0,31
Defines random PSDF loading;
The important value here is the 31, which refers to the TABRND1 card
$
TABRND1       31     LOG     LOG                                        +
+         19.999    0.01    20.0    0.01  2000.0    0.01  2000.1    0.01+
+           ENDT
Defines PSDF from 20 to 2000 Hz on a log-log scale;
First value must be slightly lower than actual frequency;
Format is Frequency, PSD,
Final value must be slightly higher than actual frequency
$
FREQ1,40,20.0,2.0,140
FREQ1,40,300.0,5.0,140
FREQ1,40,1000.0,20.0,50
FREQ3,40,20.0,2000.0
FREQx cards input frequencies where responses are recorded;
FREQ1 gives beginning frequency, freq. increment size and number of increments;
FREQ3 adds each natural frequency FROM 20 TO 2000 Hz
$
EIGRL          1      0.   2000.               0                    MASS
EIGRL determines normal modes from 0 to 2000 Hz
$
INCLUDE 'randbulk.dat'
Bulk Data can be elsewhere in a different file.
$
ENDDATA

Eignevalue Output

The eignevalue and frequency table from the .F06 file is given below. It gives the frequency range requested in the EIGRL card, 0-2000Hz. Note that the frequencies listed in this table under CYCLES correspond with the peaks in the plot at the bottom of the page.

   SINE VIBRATION EXAMPLE MODEL
   48-ELEMENT CANTILEVER BEAM ON THE X-AXIS                                                                                      
   Y-DIRECTION SINE INPUT                                                                                                        

                                           R E A L   E I G E N V A L U E S
MODE    EXTRACTION      EIGENVALUE            RADIANS             CYCLES            GENERALIZED         GENERALIZED
 NO.       ORDER                                                                       MASS              STIFFNESS
  1          1         5.673224E+03        7.532081E+01        1.198768E+01        1.000000E+00        5.673224E+03
  2          2         5.673224E+03        7.532081E+01        1.198768E+01        1.000000E+00        5.673224E+03
  3          3         2.220890E+05        4.712632E+02        7.500386E+01        1.000000E+00        2.220890E+05
  4          4         2.220890E+05        4.712632E+02        7.500386E+01        1.000000E+00        2.220890E+05
  5          5         1.733352E+06        1.316568E+03        2.095384E+02        1.000000E+00        1.733352E+06
  6          6         1.733352E+06        1.316568E+03        2.095384E+02        1.000000E+00        1.733352E+06
  7          7         6.614887E+06        2.571942E+03        4.093373E+02        1.000000E+00        6.614887E+06
  8          8         6.614888E+06        2.571942E+03        4.093373E+02        1.000000E+00        6.614888E+06
  9          9         1.793594E+07        4.235084E+03        6.740346E+02        1.000000E+00        1.793594E+07
 10         10         1.793594E+07        4.235085E+03        6.740347E+02        1.000000E+00        1.793594E+07
 11         11         3.965145E+07        6.296939E+03        1.002189E+03        1.000000E+00        3.965145E+07
 12         12         3.965146E+07        6.296940E+03        1.002189E+03        1.000000E+00        3.965146E+07
 13         13         4.175332E+07        6.461681E+03        1.028408E+03        1.000000E+00        4.175332E+07
 14         14         7.650954E+07        8.746973E+03        1.392124E+03        1.000000E+00        7.650954E+07
 15         15         7.650957E+07        8.746975E+03        1.392124E+03        1.000000E+00        7.650957E+07
 16         16         1.339317E+08        1.157289E+04        1.841882E+03        1.000000E+00        1.339317E+08
 17         17         1.339318E+08        1.157289E+04        1.841882E+03        1.000000E+00        1.339318E+08
  

Example random output of peak values.

The PSD output for GRIDs 101(T2) and 149(T2) from the run's .F06 file is given below. The output is considered to be in units of G2/Hz, while the Grms value is in G. The PSD values are actually (in/sec2)2/Hz, but because frequency is dimensionless, we can pretend that G and in/sec2 are equal, i.e., an input of 1 G comes out the same as an input of 1 in/sec2.

If force, displacement or stress output is desired however, the acceleration must be multiplied by 386.4 in/sec2 in the SPCD card to obtain pounds. (If you are using metric units of mm, then you must multiply by 9807 mm/sec2.)

The Grms values are highlighted in the fourth column. (MSC could probably do a better job of formatting their output tables!) Also of note are the minimum and maximum Y values (G2/Hz) and their corresponding X values (frequency). You will probably have to scroll to the right to see everything.

    RANDOM VIBRATION EXAMPLE MODEL
    48-ELEMENT CANTILEVER BEAM ON THE X-AXIS
    Y-DIRECTION RANDOM INPUT OF 0.01 G^2/HZ FROM 20-2000HZ

                            X Y - O U T P U T  S U M M A R Y  ( A U T O  O R  P S D F )
PLOT  CURVE   CURVE ID./       RMS       NO. POSITIVE   XMIN FOR   XMAX FOR   YMIN FOR    X FOR     YMAX FOR    X FOR
TYPE  TYPE  PANEL : GRID ID   VALUE         CROSSINGS   ALL DATA   ALL DATA   ALL DATA     YMIN     ALL DATA     YMAX

PSDF ACCE       101(  4)    4.449719E+00  1.160517E+03  2.000E+01  2.000E+03  1.000E-02  5.667E+01  1.000E-02  2.000E+01

PSDF ACCE       149(  4)    7.309907E+00  9.355332E+02  2.000E+01  2.000E+03  4.553E-03  2.000E+03  7.485E-01  7.500E+01

Example of a Random Vibration punch file output

Column 2 is Frequency, Column 3 is PSD response.

$ACCE          0     101       4                                               1
         1                  2.000000E+01        1.000000E-02                   2
         2                  2.200000E+01        1.000000E-02                   3
         3                  2.400000E+01        1.000000E-02                   4
         4                  2.600000E+01        1.000000E-02                   5
         5                  2.611154E+01        1.000000E-02                   6
         6                  2.800000E+01        1.000000E-02                   7
         7                  3.000000E+01        1.000000E-02                   8
         8                  3.200000E+01        1.000000E-02                   9
         9                  3.222308E+01        1.000000E-02                  10
        10                  3.400000E+01        1.000000E-02                  11
        11                  3.600000E+01        1.000000E-02                  12
        12                  3.800000E+01        1.000000E-02                  13
        13                  3.833462E+01        1.000000E-02                  14
        14                  4.000000E+01        1.000000E-02                  15
        15                  4.200000E+01        1.000000E-02                  16
        16                  4.400000E+01        1.000000E-02                  17
        17                  4.444616E+01        1.000000E-02                  18
        18                  4.600000E+01        1.000000E-02                  19
        19                  4.800000E+01        1.000000E-02                  20
        20                  5.000000E+01        1.000000E-02                  21
         .                       .                   .                         .
         .                       .                   .                         .
         .                       .                   .                         .
       408                  1.964863E+03        1.000000E-02                 409
       409                  1.980000E+03        1.000000E-02                 410
       410                  1.982431E+03        1.000000E-02                 411
       411                  2.000000E+03        1.000000E-02                 412
$ACCE          0     149       4                                             413
         1                  2.000000E+01        2.482271E-02                 414
         2                  2.200000E+01        1.892970E-02                 415
         3                  2.400000E+01        1.569268E-02                 416
         4                  2.600000E+01        1.378317E-02                 417
         .                       .                   .                         .
         .                       .                   .                         .
         .                       .                   .                         .
       410                  1.982431E+03        5.579197E-03                 823
       411                  2.000000E+03        4.553379E-03                 824

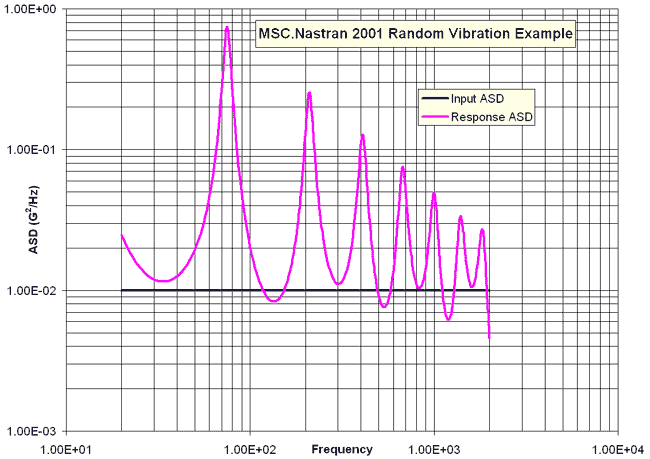
Plot of the Example Random Vibration Data

Below is a plot of the data given in the punch file (random_test.pch). It shows the input and the response. The input is a straight line at .01 G2/Hz. The response shows the peaks corresponding to the modes of the beam.

Random example response plot

Example Files

You can download the three files for this example to run and study:
random_test.dat, random_test.f06, and random_test.pch.

Ryan Simmons
July 2001, updated September 2007

HOME | FEMCI BOOK | PRESENTATIONS | REFERENCES | WORKSHOP | LINKS | ABOUT | MINUTES | PRIVACY