

Random Vibration Specification Magnitude Equations
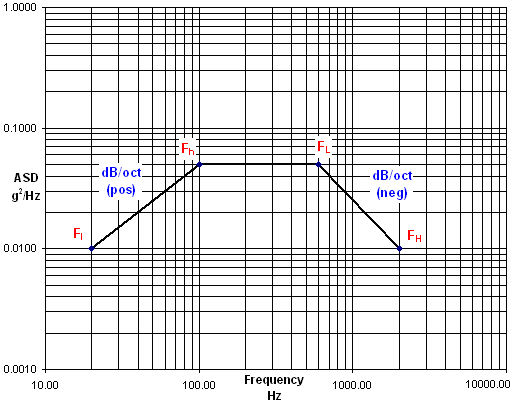
When performing a random vibration analysis, an input spec is generally given in a form such as the log-log plot in the figure or written in the table below. The problem is what to do with such information. We cannot input these values directly into NASTRAN because it will not accept a slope in dB/Oct. Individual points in G2/Hz vs. Hz are required. This page details how to get from the input to graphical points needed.

(Note that regardless of popular opinion, G2/Hz is actually an acceleration spectral density (ASD), not a power spectral density (PSD). PSD refers to the actual plot generated during testing, which simply reads the power output from the accelerometers.)
In tabular form, the input may be given in this form (beginning and ending frequencies are not always necessary if a continuous line is assumed):
| Random Input Spec | |
| 3.01 dB/Oct | |
| 100.00 Hz | 0.0500 G2/Hz |
| 600.00 Hz | 0.0500 G2/Hz |
| -4.02 dB/Oct | |
Because no beginning or ending frequencies, Fl and FH, are given in this table, they must first be decided upon. This is generally project specific. However, the frequency range is usually 20Hz to 2000Hz. From the graph, Fl = 20Hz and FH = 2000Hz. Fh and FL are 100Hz and 600Hz, respectively.
First, determine the number of octaves between the two frequencies. Keep in mind that an octave is the doubling of the frequency. So going from 1Hz to 2Hz is an octave and going from 1000Hz to 2000Hz is also an octave. Thus, the number of octaves could be estimated from the graph above. The equation to calculate the exact number is:

where FH is the higher frequency and FL is the lower frequency.
Second, determine the number of dB by multiplying the number of octaves by the slope, making sure to use the correct sign (positive or negative) for the slope:

The previous equation also shows the definition of dB, where ASDH and ASDL are the acceleration spectral densities for the higher and lower frequencies respectively (NOT for the higher and lower ASD values! That is, ASDL can be greater than ASDH whereas FH is always greater than FL).
Finally, solve for the ASD at the desired frequency:

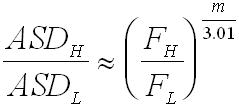
Or, for those of you who want a more expanded and complete version (where m is the slope in dB/Oct):

And a final, simplified version:

I'll leave it up to you to use the example given in the graph above to prove that the equations work.
A Microsoft Excel 97 spreadsheet, grms.xls, is available that will calculate the dB, octaves, dB/Oct, and grms values of a random vibration curve. Unfortunately, this spreadsheet needs the frequency and ASD values as inputs. But once you've calculated your ASD values, you can input them into this spreadsheet as a check to see if you did your math correctly.
An Excel 95 version, grms95.xls, is also available.
Thanks to Bob Coladonato and Dr. Bill Case, both retired from Goddard, and Jaap Wijker of University of Technology Delft in the Netherlands for their assistance with this page.
Ryan Simmons
August 1997