


The User's Guide to Running STOCS
(Structural Thermal Optical Component Shifts)
Lt. Cindy Hustedde - United States Air Force (formerly of NASA GSFC)
November 12, 1994 (Last revision 1/95)
Contact: Jeff Bolognese - NASA GSFC
This document is designed to assist the brand-new user to understand and be able to use the STOCS program. It will go over step by step the inputs the program needs and what they mean.
NOTE: This program is available to NASA Goddard employees and contractors only.
Table of Contents
- APPENDIX A: Relevent Equations for STOCS Analysis
- APPENDIX B: Files and Hand Calculations for Example 1
- APPENDIX C: Files and Hand Calculations for Example 2
INTRODUCTION
STOCS (Structural Thermal Optical Component Shifts) is a preliminary analysis tool used to determine thermal deformations of optical elements due to either bulk temperature changes or gradients. There are some key points that must be understood before creating a STOCS model: (1) the program always assumes mounts are kinematic, (2) structures are represented as volumes, (3) grid points are used to represent points of interest (usually located on an optical element) and attachment points for other structures, and (4) it is required that all of the grid points of a structure lie inside its volume.
This tutorial will walk through a simple example problem and will demonstrate a batch file run with another example. Example hand calculations can be found in the appendices.
RUNNING THE PROGRAM
The STOCS program can be run in either interactive or batch modes. Interactive mode is the starting point for a new model. The program will step you through the data entry to create an input file. Later runs can then be made in batch mode using the already created input file.
The STOCS program is kept in the SYS$SYSDISK:[USER] directory on "merger". To run the program type @SYS$SYSDISK:[USER]STOCS at the prompt. For repeated runs, it is easier to add this line to your login.com file "$STOCS:== @SYS$SYSDISK:[USER]STOCS.COM". Then to run the program simply type "STOCS" at the prompt. The program will then requests the name of the model input file. If this is a new model type "TT:"; otherwise enter the name of the input file. The program is also located on the UNIX machines in /usr/local/bin/stocs.
All alpha data entered into the program must be in capital letters so enable the CAPS LOCK. Also, all numerical real number data must include a decimal point.
GEOMETRICAL DATA ENTRY
Example:
We will begin with a simple example which involves three structures. Structure 1 is the base, or ground, structure and Structures 2 and 3 are attached to and centered on the top of structure one. Grid points are assigned to all attachment points and to every point of interest on the structures. Structure one has dimensions 5' x 3' x 3' and has three grid points: Point 1 is at the center of the structure (which is also the origin) and points 2 and 3 are attachment points at the top of the structure. Structure two has dimensions 2' x 2' x 2' and has two grid points: 4 and 6 where point 4 is an attachment point. Structure three has dimensions 1.5' x 2' x 1.5' and has two grid points: 5 and 7 where point 5 is an attachment point. Points 6 and 7 represent optical elements. The grid point locations are listed below and located on the diagram on the next page:
    Grid         Location
              x      y      z
     1       0.0    0.0    0.0
     2      -1.0    0.0    1.5
     3       1.5    0.0    1.5
     4      -1.0    0.0    1.5
     5       1.5    0.0    1.5
     6      -1.0   -0.5    3.5
     7       1.5   -0.5    3.0
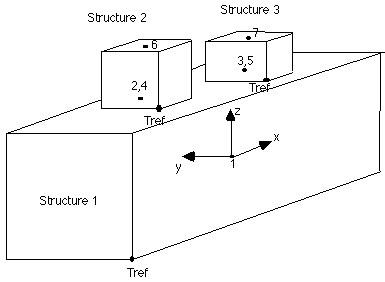
Figure 1 - Example Structure
The next step is to determine the temperature reference locations and the volumes of the structures. Each structure can have a separate temperature reference location. Choose the right front corner of Structure 1 to be its temperature reference location (-2.5, -1.5, -1.5). We must verify that all of the grid points for Structure 1 are enclosed by its volume from the temperature reference location. If a grid point is not contained in the structure's volume, the volume or the temperature reference location must be changed. This must be done for each of the structures; below are the temperature reference locations and volume dimensions of each of the structures.
   Structure        Volume               T ref
       1         5' x 3' x 3'      -2.5,  -1.5, -1.5
       2         2' x 2' x 2'      -2.0,  -0.5,  1.5
       3       1.5' x 2' x 1.5'    0.75, -0.75,  1.5
Now all of the geometry has been determined and it is time to start the program: type STOCS (This assumes you changed the login.com file as reccommended) at the prompt of the directory where you want to store the saved model files. (Also check that CAPS LOCK is enabled). The following is a listing of each of the prompts in the program. Enter each answer and press return.
The program begins requesting an input data file if available:
-
ENTER NAME OF INPUT DATA FILE (can be TT):
Answer: TT
SELECT PROGRAM MODE: 1=INTERACTIVE MODE; 2=BATCHMODE.
Answer: 1
ENTER TITLE CARD (UP TO 72 CHARACTERS)
Answer: EXAMPLE PROBLEM
DO YOU WANT A DISK FILE CREATED TO SAVE AN ECHO OF INPUT DATA? (Y OR N)
Answer: Y
Always answer yes because you can make slight changes to this file and then run it in batch mode later. This will save a tremendous amount of time if several runs must be made.
-
TYPE NAME OF INPUT FILE (UP TO 12 CHAR)
Answer: EXAMPLE1.INP
NOTE: The 12 characters includes the period. If the period is omitted, the default file type will be ".DAT".
-
DO YOU WANT A DISK FILE CREATED FOR PRINTED OUTPUT? (Y OR N)
Answer: Y
Having an output file is the easiest way to view the data.
-
TYPE NAME OF OUTPUT FILE (UP TO 12 CHAR)
Answer: EXAMPLE1.OUT
DO YOU WANT A DISK FILE CREATED WITH DATA FOR USE IN OP-STOP PROGRAM?
Answer: N
Apparently the OPSTOP, optical analysis, program is no longer in use.
-
DO YOU WANT OUTPUT FOR THE BASIC REFERENCE SYSTEM TO BE IN CARTESIAN OR POLAR COORDINATES? (C OR P)
Answer: C
NOTE: Use Cartesian coordinates for this example.
-
HOW MANY STRUCTURES ARE THERE? (25 MAX)
Answer: 3
Structure 1
-
ENTER STRUCTURE ID NUMBER (TO 25)
Answer: 1
ARE THE LOCAL COORDINATES CARTESIAN OR POLAR? (C OR P)
Answer: C
ENTER X, Y AND Z BODY DIMENSIONS, THERMAL EXPANSION COEFFICIENT, NUMBER OF
STAND ALONE (ANALYSIS) GRID POINTS AND NUMBER OF GRID POINTS TO WHICH LOWER
LEVEL SUBSTRUCTURES DO ATTACH
Answer: 5.0,3.0,3.0,1.0E-6,1,2
Free-form data entry. Do not skip any entries.
X, Y, Z body dimensions. Does not necessarily mean the actual geometrical volume of the structure but should generally encompass the actual structure. It must also enclose all of a structure's grid points when the volume is defined from the temperature reference location.
Thermal Expansion Coefficient. Needs compatible units with other data entries.
Stand Alone Grid Points. In structure one there is only one stand alone grid point.
Grid Points that Substructures Attach (Attachment points). These points are exactly that: points where substructures attach. In structure one this refers to points 2 and 3.
-
ENTER GRID POINT NUMBER, LOCAL X,Y AND Z COORDINATES, AND OFFSETS FOR EACH
POINT IN THE STRUCTURE TO WHICH SUBSTRUCTURES DO NOT ATTACH.
GRID POINT
Answer: 1,0.0,0.0,0.0
Grid Point Number. A unique ID number for each of the stand alone grid points.
Offsets. If the point of interest for calculations is not the actual grid point an offset is defined. The offset is the location where calculations will be done for that grid point. In this example no offset is given.
-
ENTER GRID POINT NUMBER, LOCAL X,Y AND Z COORDINATES, AND OFFSETS FOR EACH
POINT TO WHICH LOWER LEVEL SUBSTRUCTURES ATTACH. LOWER LEVEL SUBSTRUCTURES
WILL ATTACH AT THESE OFFSET POINTS, IF PRESENT.
GRID POINT
Answer: 2,-1.0,0.0,1.5
3,1.5,0.0,1.5
Grid Point Number. A unique ID number for the attachment grid points.
Offsets. Defined above.
-
ENTER THE TEMPERATURE REFERENCE LOCATION IN LOCAL COORDINATES
Answer: -2.5,-1.5,-1.5
Temperature Reference Location. Each substructure is assigned a temperature reference location so loads can be applied to each substructure separately. The temperature reference location specifies where the temperature will be zero for gradients. It is related to the volume in that all structure grid points must be contained in the volume defined from the temperature reference location.
NOTE: This is the lower front right corner of structure one as pictured in Figure 1.
The same questions are repeated for Structures 2 and 3.
Structure 2
-
ENTER STRUCTURE ID NUMBER (TO 25)
Answer: 2
ARE THE LOCAL COORDINATES CARTESIAN OR POLAR? (C OR P)
Answer: C
ENTER X, Y AND Z BODY DIMENSIONS, THERMAL EXPANSION COEFFICIENT, . . .
Answer: 2.0,2.0,2.0,1.0E-6,2,0
NOTE: There are no lower level substructures attached to Structure 2.
-
ENTER GRID POINT NUMBER, LOCAL X,Y AND Z COORDINATES, . . . SUBSTRUCTURES DO NOT ATTACH.
Answer: 4,-1.0,0.0,1.5
{NOTE: There are no offsets} 6,-1.0,-0.5,3.5
NOTE: Point 4 is coincident with grid point 2.
-
ENTER THE TEMPERATURE REFERENCE LOCATION IN LOCAL COORDINATES
Answer: -2.0,-0.5,1.5
NOTE: This is the lower front right corner of structure two as pictured in Figure 1.
Structure 3
-
ENTER STRUCTURE ID NUMBER (TO 25)
Answer: 3
ARE THE LOCAL COORDINATES CARTESIAN OR POLAR? (C OR P)
Answer: C
ENTER X, Y AND Z BODY DIMENSIONS, THERMAL EXPANSION COEFFICIENT, . . .
Answer: 1.5,2.0,1.5,1.0E-6,2,0
NOTE: There are no lower level substructures attached to Structure 3.
-
ENTER GRID POINT NUMBER, LOCAL X,Y AND Z COORDINATES, . . . SUBSTRUCTURES DO NOT ATTACH.
Answer: 5,1.5,0.0,1.5
{NOTE: There are no offsets} 7,1.5,-0.5,3.0
NOTE: Each structure must have a grid point where they can be attached. In this example point 5 in Structure 2 is coincident with grid point 3 in Structure 1. Later the constraints for attaching these points will be defined. If offsets exist for either of these points a moment would be induced causing rotation when the load is applied.
-
ENTER THE TEMPERATURE REFERENCE LOCATION IN LOCAL COORDINATES
Answer: 0.75,-0.75,1.5
NOTE: This is the lower front right corner of structure three as pictured in Figure 1.
Now all of the geometrical data has been entered and you are presented with a "branch selector" from which any corrections of the data can be made. These changes are simply appended to the input file which means this data is out of place with respect to the original data. It may be easier to just make the change in the input file later. However, some mistakes in the data will cause errors when the load data is entered which will put you in an endless loop and you will have to start over. The best advice is to not make mistakes!
LOAD DATA ENTRY
For this example we will apply a bulk temperature change to each structure. Then we will use batch mode to apply a gradient load to structure one.
-
ENTER BRANCH SELECTOR:
1 = START OVER AND RE-DEFINE STRUCTURES IN TREE
2 = LIST EXISTING MODEL DATA
3 = MAKE CHANGES IN EXISTING MODEL DATA
4 = APPLY NEW CONSTRAINTS AND LOADS TO AN EXISTING STRUCTURE
5 = APPLY SAME CONSTRAINTS BUT NEW LOADS TO PROBLEM JUST SOLVED
6 = EXIT PROGRAM. CLOSE ALL DISK FILES PREVIOUSLY OPENED.
Answer: 4
ENTER ID OF STRUCTURE TO BE ANALYZED
Answer: 1
ARE THE BASIC AND LOCAL COORDINATES PARALLEL? (Y OR N)
Answer: Y
IS THIS THE GROUND STRUCTURE? (Y OR N)
Answer: Y
WOULD YOU LIKE THE LOCAL DEFORMATIONS AND ROTATIONS DISPLAYED? (Y OR N)
Answer: Y
WOULD YOU LIKE THE CUMULATIVE DEFORMATIONS AND ROTATIONS IN BASIC COORDINATES? (Y OR N)
Answer: Y
NOTE: Cumulative deformations refers to the total deformation of substructures and are the values calculated in Appendices B and C for the example problems.
-
SELECT FORMAT FOR ENTERING CONSTRAINT INFORMATION:
1. GRID POINT ID, DOF CONSTRAINED AND INITIAL DEFORMATION
2. LOCAL X,Y AND Z COORDINATES, DOF CONSTRAINED AND INITIAL DEFORMATION
Answer: 1
NOTE: Format 1 is usually the easiest to input.
-
CONSTRAINT
Answer:
1,1
1,2
1,3
1,4
1,5
1,6
NOTE: STOCS assumes you are using kinematic mounts therefore there must be 6 constrained degrees of freedom.
-
ENTER TITLE CARD FOR THIS LOAD CASE (UP TO 72 CHAR)
Answer: BULK TEMP STRUCTURE 1
ENTER BULK DELTAT, DTX, DTY AND DTZ
Answer: 1.0,0.0,0.0,0.0
After you have completed entries for the first structure you will be returned to the branch selector. Choose 4 again to apply new constaints and loads to existing structure and repeat the above entries for applying a one degree bulk temperature load to Structure 2. Then repeat again for Structure 3. The only difference in input will be that these structures are not ground structures and therefore the format for entering constraint information will be different.
-
SELECT FORMAT FOR ENTERING CONSTRAINT INFORMATION:
1. ID OF MOUNT GRID POINT IN PARENT STRUCTURE, ID OF SAME GRID POINT IN SUBSTRUCTURE, DOF CONSTRAINED AND INITIAL DEFORMATION
2. ID OF GRID POINT IN PARENT STRUCTURE, LOCAL X,Y AND Z COORDINATES, DOF CONSTRAINED AND INITIAL DEFORMATION.
Answer: 1
NOTE: Again, format 1 is usually the easiest to input.
-
CONSTRAINT
Answer:
2,4,1
2,4,2
2,4,3
2,4,4
2,4,5
2,4,6
NOTE: In this example we constrained one point in 6 directions as our kinematic mount. Grid points 2 and 4 are coincident nodes in this example where 2 is the point on the ground structure and 4 is the attachment point on Structure 2. If these points have an offset this would cause a moment when the load is applied.
For Structure 3, constrain grid point 5 (coincident with point 3) in all 6 degrees of freedom similar to the example above.
Upon returning to the branch selector, choose 6 to close the files and end the program. Compare the output file to the example output file in Appendix B. If there are any discrepancies see the input file and the hand calculations also in Appendix B.
BATCH MODE
Next we will edit the EXAMPLE1.INP file to change the load to a bulk temperature load of 1 degree on Structure 1 and a gradient load of 1degree on Structures 2 and 3. The follwing changes need to be made to the file:
- Edit EXAMPLE1.INP
- Change input file name, EXAMPLE1.INP, to EXAMPLE2.INP
- Change output file name, EXAMPLE1.OUT, to EXAMPLE2.OUT
- Change the title card for Structure 2 from "BULK TEMP STRUCTURE 1" to "GRADIENT = 1 ON STRUCTURE 2". Repeat for Structure 3.
- Change the bulk temperature loads on Structures 2 and 3 to zero and the gradient in the x direction to 1.000000000000000.
- Save the file as EXAMPLE2.INP
Compare this input file to the example input file in Appendix C. When the changes are complete execute the file by typing "STOCS" at the prompt. At the filename prompt type "EXAMPLE2.INP". The program will end at the branch selector where you will choose 6 to end the program. Compare the output file to the output file in Appendix C.
STOCS ANALYSIS
When a STOCS analysis is performed there are several test cases which must be accomplished to complete the thermal analysis. These runs include applying a 1 degree bulk temperature in the x, y, and z directions separately for each individual structure and applying a 1 degree gradient in the x, y, and z directions separately for each individual structure. A run with a bulk temperature on every structure in every direction is performed, as well as a 1 degree gradient on every structure in every direction. This results in at least 6 runs per structure plus the two runs for the bulk and gradient loads on everything.
APPENDIX A
RELEVANT EQUATIONS FOR STOCS ANALYSIS
Relevant Equations
The STOCS program is based on a few basic equations which can be used to spot check the results. The following is a list of the equations and an explanation of the variables involved. Appendix B and C will use these equations to verify the example problems in this document.
The first equation is the temperature equation which is used to calculate the temperature of each structure:
| T(x,y,z) = Tc + DeltaTx/lx (x - xt) + DeltaTy/ly (y - yt) + DeltaTz/lz (z - zt) | (1) |
The equations representing the displacement in the x, y, and z directions of a node are
| u = CTE { T xd - DeltaTx / 2lx (xd2 + yd2 + zd2) } + zd qyo, - yd qzo, + uo |
(2) | |
| v = CTE { T yd - DeltaTy / 2ly (xd2 + yd2 + zd2) } - zd qxo, + xd qzo, + vo |
(3) | |
| w = CTE { T zd - DeltaTz / 2lz (xd2 + yd2 + zd2) } + yd qxo, - xd qyo, + wo |
(4) |
The equations representing the rotational displacements of a node are:
| qx = CTE { DeltaTy/ly (zd) - DeltaTz/lz (yd) } + qxo |
(5) | |
| qy = CTE { DeltaTz/lz (xd) - DeltaTx/lx (zd) } + qyo |
(6) | |
| qz = CTE { DeltaTx/lx (yd) - DeltaTy/ly (xd) } + qzo |
(7) |
Explanation of the variables used:
| T(x,y,z) |
linear temperature distribution for a particular structure |
| Tc |
bulk temperature for the structure |
| DeltaTx, DeltaTy, DeltaTz |
gradient in the respective directions |
| lx, ly, lz |
body dimensions of the structure |
| x, y, z |
point of interest coordinates |
| xt, yt, zt |
coordinates of the temperature reference location |
| CTE |
coefficient of thermal expansion |
| T |
same as T(x,y,z) above |
| xd, yd, zd |
distance from grid point to the constrained grid of the structure |
| qxo, qyo, qzo |
initial rotations usually due to parented structures |
| uo, vo, wo |
initial displacement usually due to parented structures |
APPENDIX B
FILES AND HAND CALCULATIONS FOR EXAMPLE 1
Hand Calculations
Structure 1
The following data is needed to perform calculations for Structure 1.
- (xt, yt, zt) = (-2.5, -1.5, -1.5)
(lx, ly, lz) = (5.0, 3.0, 3.0)
Initial displacement values for Structure 1 are zero since this is the ground structure
- (uo, vo, wo) = (0.0, 0.0, 0.0)
(qxo, qyo, qzo) = (0.0, 0.0, 0.0)
Grid 1
- (x, y, z) = (0.0, 0.0, 0.0)
(xd, yd, zd) = (0.0, 0.0, 0.0)
This structure has a 1 degree bulk temperature load. Using equation1 from appendix A to calculate the temperature distribution
| T(x,y,z) = Tc + DeltaTx/lx (x - xt) + DeltaTy/ly (y - yt) + DeltaTz/lz (z - zt) | (1) | |
| T(0,0,0) = 1.0 + 0.0/5 (0 - (-2.5)) + 0.0/3 (0 - (-1.5)) + 0.0/3 (1.5 - (-1.5)) | ||
| T(0,0,0) = 1.0 |
Using equations 2-4 in Appendix A to calculate displacements
| u = CTE { T xd - DeltaTx / (2lx)(xd2 + yd2 + zd2) } + zd qyo, - yd qzo, + uo |
(2) | |
| = (1.0e-6){(1.0)(0.0) - 0/10(0 + 0 + 0) } + 0(0) - 0(0) + 0 | ||
| = 0.0e0 | ||
| v = CTE { T yd - DeltaTy / (2ly)(xd2 + yd2 + zd2) } - zd qxo, + xd qzo, + vo |
(3) | |
| = (1.0e-6){(1.0)(0.0) - 0/6(0 + 0 + 0) } - 0(0) + 0(0) + 0.0 | ||
| = 0.0e0 | ||
| w = CTE { T zd - DeltaTz / (2lz)(xd2 + yd2 + zd2) } + yd qxo, - xd qyo, + wo | (4) | |
| = (1.0e-6){(1.0)(0.0) - 0/6(0 + 0 + 0) } + 0(0) - 0(0) + 0.0 | ||
| = 0.0e0 |
Using equations 5-7 in Appendix A to calculate the rotations
| qx = CTE { DeltaTy/ly (zd) - DeltaTz/lz (yd) } + qxo | (5) | |
| = (1e-6){0/3 (0) - 0/3 (0)} + 0 | ||
| = 0.0e0 | ||
| qy = CTE { DeltaTz/lz (xd) - DeltaTx/lx (zd) } + qyo | (6) | |
| = (1e-6){0/3 (0) - 1/5 (0)} + 0 | ||
| = 0.0e0 | ||
| qz = CTE { DeltaTx/lx (yd) - DeltaTy/ly (xd) } + qzo | (7) | |
| = (1e-6){1/5 (0) - 0/3 (0)} + 0 | ||
| = 0.0e0 |
Grid 2
- (x, y, z) = (-1.0, 0.0, 1.5)
(xd, yd, zd) = (-1.0, 0.0, 1.5)
This structure has a 1 degree bulk temperature load. Using equation1 from appendix A to calculate the temperature distribution
| T(x,y,z) = Tc + DeltaTx/lx (x - xt) + DeltaTy/ly (y - yt) + DeltaTz/lz (z - zt) | (1) | |
| T(0,0,0) = 1.0 + 0.0/5 (-1 - (-2.5)) + 0.0/3 (0 - (-1.5)) + 0.0/3 (1.5 - (-1.5)) | ||
| T(0,0,0) = 1.0 |
Using equations 2-4 in Appendix A to calculate displacements
| u = CTE { T xd - DeltaTx / (2lx)(xd2 + yd2 + zd2) } + zd qyo, - yd qzo, + uo | (2) | |
| = (1.0e-6){(1.0)(-1.0) - 0/10(1+ 0 + 2.25) } + 2.25(0) - 0(0) + 0 | ||
| = -1.0e-6 | ||
| v = CTE { T yd - DeltaTy / (2ly)(xd2 + yd2 + zd2) } - zd qxo, + xd qzo, + vo | (3) | |
| = (1.0e-6){(1.0)(0.0) - 0/6(0 + 0 + 0) } - 1.5(0) + (-1.0)(0) + 0.0 | ||
| = 0.0e0 | ||
| w = CTE { T zd - DeltaTz / (2lz)(xd2 + yd2 + zd2) } + yd qxo, - xd qyo, + wo | (4) | |
| = (1.0e-6){(1.0)(1.5) - 0/6(0 + 0 + 0) } + 0(0) - (-1.0)(0) + 0.0 | ||
| = 1.5e-6 |
Using equations 5-7 in Appendix A to calculate the rotations
| qx = CTE { DeltaTy/ly (zd) - DeltaTz/lz (yd) } + qxo | (5) | |
| = (1e-6){0/3 (1.5) - 0/3 (0)} + 0 | ||
| = 0.0e0 | ||
| qy = CTE { DeltaTz/lz (xd) - DeltaTx/lx (zd) } + qyo | (6) | |
| = (1e-6){0/3 (-1.0) - 1/5 (1.5)} + 0 | ||
| = 0.0e0 | ||
| qz = CTE { DeltaTx/lx (yd) - DeltaTy/ly (xd) } + qzo | (7) | |
| = (1e-6){1/5 (0) - 0/3 (-1.0)} + 0 | ||
| = 0.0e0 |
Grid 3
- (x, y, z) = (1.5, 0.0, 1.5)
(xd, yd, zd) = (1.5, 0.0, 1.5)
Using the above data, the data for Structure 1 and equations 1-7 the following results are obtained.
| T(1.5, 0.0, 1.5) = 1.0 |
|
| u = 1.5e-6 |
qx = 0.0e0 |
| v = 0.0e0 |
qy = 0.0e0 |
| w = 1.5e-6 |
qz = 0.0e0 |
NOTE: All of the rotations are displayed as radians and the output file from the STOCS program displays them as milli-radians and arc-seconds.
Structure 2
The following data is needed to perform calculations for Structure 2.
- (xt, yt, zt) = (-2.0, -0.5, 1.5)
(lx, ly, lz) = (2.0, 2.0, 2.0)
From point 2 on Structure 1 (which is coincident with point 4 on Structure 2) the initial displacement values for Structure 2 are
- (uo, vo, wo) = (-1.0e-6, 0.0e0, 1.5e-6)
(qxo, qyo, qzo) =(0.0, 0.0, 0.0)
Grid 4
- (x, y, z) = (-1.0, 0.0, 1.5)
(xd, yd, zd) = (0.0, 0.0, 0.0)
Using the above data, the data for Structure 2 and equations 1-7 the following results are obtained.
| T(-1.0, 0.0, 1.5) = 1.0 |
|
| u = -1.0e-6 |
qx = 0.0e0 |
| v = 0.0e0 |
qy = 0.0e0 |
| w = 1.5e-6 |
qz = 0.0e0 |
NOTE: All of the rotations are displayed as radians and the output file from the STOCS program displays them as milli-radians and arc-seconds. Also displacements are cumulative.
Grid 6
- (x, y, z) = (-1.0, -0.5, 3.5)
(xd, yd, zd) = (0.0, -0.5, 2.0)
Using the above data, the data for Structure 2 and equations 1-7 the following results are obtained.
| T(-1.0, -0.5, 3.5)= 1.0 | |
| u = -1.0e-6 | qx = 0.0e0 |
| v = -0.5e-6 | qy = 0.0e0 |
| w = 3.5e-6 | qz = 0.0e0 |
NOTE: All of the rotations are displayed as radians and the output file from the STOCS program displays them as milli-radians and arc-seconds. Also displacements are cumulative.
Structure 3
Structure 3 has a gradient load of 1 degree in the x direction. The following data is needed to perform calculations for Structure 2.
- (xt, yt, zt) = (0.75, -0.75, 1.5)
(lx, ly, lz) = (1.5, 2.0, 1.5)
From point 3 on Structure 1 (which is coincident with point 5 on Structure 3) the initial displacement values for Structure 2 are
- (uo, vo, wo) = (1.5e-6, 0.0e0, 1.5e-6)
(qxo, qyo, qzo) =(0.0, 0.0, 0.0)
Grid 5
- (x, y, z) = (1.5, 0.0, 1.5)
(xd, yd, zd) = (0.0, 0.0, 0.0)
Using the above data, the data for Structure 3 and equations 1-7 the following results are obtained.
| T(1.5, 0.0, 1.5)= 1.0 |
|
| u = 1.5e-6 |
qx = 0.0e0 |
| v = 0.0e0 |
qy = 0.0e0 |
| w = 1.5e-6 |
qz = 0.0e0 |
NOTE: All of the rotations are displayed as radians and the output file from the STOCS program displays them as milli-radians and arc-seconds. Also displacements are cumulative.
Grid 7
- (x, y, z) = (1.5, -0.5, 3.0)
(xd, yd, zd) = (0.0, -0.5, 3.0)
Using the above data, the data for Structure 2 and equations 1-7 the following results are obtained.
| T(1.5, -0.5, 3.0) = 1.0 | |
| u = 1.5e-6 | qx = 0.0e0 |
| v = -0.5e-6 | qy = 00e0 |
| w = 3.0e-6 | qz = 0.0e0 |
Note all of the rotations are displayed as radians and the output file from the STOCS program displays them as milli-radians and arc-seconds. Also displacements are cumulative.
APPENDIX C
FILES AND HAND CALCULATIONS FOR EXAMPLE 2
Hand Calculations
The thermal load for example 2 was a bulk temperature of 1 degree on structure one with a 1 degree gradient in the x-direction on Structures 2 and 3. Since structure one is under the same loadings as example 1 the results are the same and are summarized here
Structure 1
           GRID       u              v              w
            1       0.0e0          0.0e0          0.0e0
            2      -1.0e-6         0.0e0          1.5e-6
            3       1.5e-6         0.0e0          1.5e-6
Structure 2
The following data is needed to perform calculations for Structure 2.
- (xt, yt, zt) = (-2.0, -0.5, 1.5)
(lx, ly, lz) = (2.0, 2.0, 2.0)
From point 2 on Structure 1 (which is coincident with point 4 on Structure 2) the initial displacement values for Structure 2 are
- (uo, vo, wo) = (-1.0e-6, 0.0e0, 1.5e-6)
(qxo, qyo, qzo) =(0.0, 0.0, 0.0)
Grid 4
- (x, y, z) = (-1.0, 0.0, 1.5)
(xd, yd, zd) = (0.0, 0.0, 0.0)
This structure has a 1 degree gradient load in the x direction. Using equation1 from appendix A to calculate the temperature distribution
| T(x,y,z) = Tc + DeltaTx/lx (x - xt) + DeltaTy/ly (y - yt) + DeltaTz/lz (z - zt) | (1) | |
| T(-1,0,1.5) = 0.0 + 1.0/2 (-1 - (-2)) + 0.0/2 (0 - (-.5)) + 0.0/2 (1.5 - 1.5) | ||
| T(-1,0,1.5) = 0.5 |
Using equations 2-4 in Appendix A to calculate displacements
| u = CTE { T xd - DeltaTx / 2lx (xd2 + yd2 + zd2) } + zd qyo, - yd qzo, + uo | (2) | |
| = (1.0e-6){(0.5)(0.0) - 1/4(0 + 0 + 0) } + 0(0) - 0(0) + (-1e-6) | ||
| = -1e-6 | ||
| v = CTE { T yd - DeltaTy / 2ly (xd2 + yd2 + zd2) } - zd qxo, + xd qzo, + vo | (3) | |
| = (1.0e-6){(0.5)(0.0) - 0/4(0 + 0 + 0) } - 0(0) + 0(0) + 0.0 | ||
| = 0.0e0 | ||
| w = CTE { T zd - DeltaTz / 2lz (xd2 + yd2 + zd2) } + yd qxo, - xd qyo, + wo | (4) | |
| = (1.0e-6){(0.5)(0.0) - 0/4(0 + 0 + 0) } + 0(0) - 0(0) + (1.5e-6) | ||
| = 1.5e-6 |
Using equations 5-7 in Appendix A to calculate the rotations
| qx = CTE { DeltaTy/ly (zd) - DeltaTz/lz (yd) } + qxo | (5) | |
| = (1e-6){0/2 (0) - 0/2 (0)} + 0 | ||
| = 0.0 | ||
| qy = CTE { DeltaTz/lz (xd) - DeltaTx/lx (zd) } + qyo | (6) | |
| = (1e-6){0/2 (0) - 1/2 (0)} + 0 | ||
| = 0.0 | ||
| qz = CTE { DeltaTx/lx (yd) - DeltaTy/ly (xd) } + qzo | (7) | |
| = (1e-6){1/2 (0) - 0/2 (0)} + 0 | ||
| = 0.0 |
Grid 6
- (x, y, z) = (-1.0, -0.5, 3.5)
(xd, yd, zd) = (0.0, -0.5, 2.0)
Using the above data, the data for Structure 2 and equations 1-7 the following results are obtained.
| T(-1, -0.5, 3.5) = 0.5 |
|
| u = -2.062e-6 |
qx = 0.0e0 |
| v = -0.25e-6 |
qy = -1e-6 |
| w = 2.5e-6 |
qz = -0.25e-7 |
NOTE: All of the rotations are displayed as radians and the output file from the STOCS program displays them as milli-radians and arc-seconds.
Structure 3
Structure 3 has a gradient load of 1 degree in the x direction. The following data is needed to perform calculations for Structure 2.
- (xt, yt, zt) = (0.75, -0.75, 1.5)
(lx, ly, lz) = (1.5, 2.0, 1.5)
From point 3 on Structure 1 (which is coincident with point 5 on Structure 3) the initial displacement values for Structure 2 are
- (uo, vo, wo) = (1.5e-6, 0.0e0, 1.5e-6)
(qxo, qyo, qzo) =(0.0, 0.0, 0.0)
Grid 5
- (x, y, z) = (1.5, 0.0, 1.5)
(xd, yd, zd) = (0.0, 0.0, 0.0)
Using the above data, the data for Structure 2 and equations 1-7 the following results are obtained.
| T(1.5, 0.0, 1.5) = 0.5 | |
| u = 1.5e-6 | qx = 0.0e0 |
| v = 0.0e0 | qy = 0.0e0 |
| w = 1.5e-6 | qz = 0.05e0 |
NOTE: All of the rotations are displayed as radians and the output file from the STOCS program displays them as milli-radians and arc-seconds.
Grid 7
- (x, y, z) = (1.5, -0.5, 3.0)
(xd, yd, zd) = (0.0, -0.5, 3.0)
Using the above data, the data for Structure 2 and equations 1-7 the following results are obtained.
| T(1.5, -0.5, 3.0) = 0.5 | |
| u = 0.667e-6 | qx = 0.0e0 |
| v = -0.25e-6 | qy = -1.0e-6 |
| w = 1.5e-6 | qz = 0.333e-6 |
NOTE: All of the rotations are displayed as radians and the output file from the STOCS program displays them as milli-radians and arc-seconds.
Lt. Cindy Hustedde
Jeff Bolognese